Offline Spike Sorter
Spike sorting, the detection and clustering of neuron activities from extracellular recording, is one the most important steps in neural activity monitoring. Here, we introduce an open-source offline spike sorting software. This software provides lots of features for automatic and manual spike sorting. It is developed based on MATLAB.
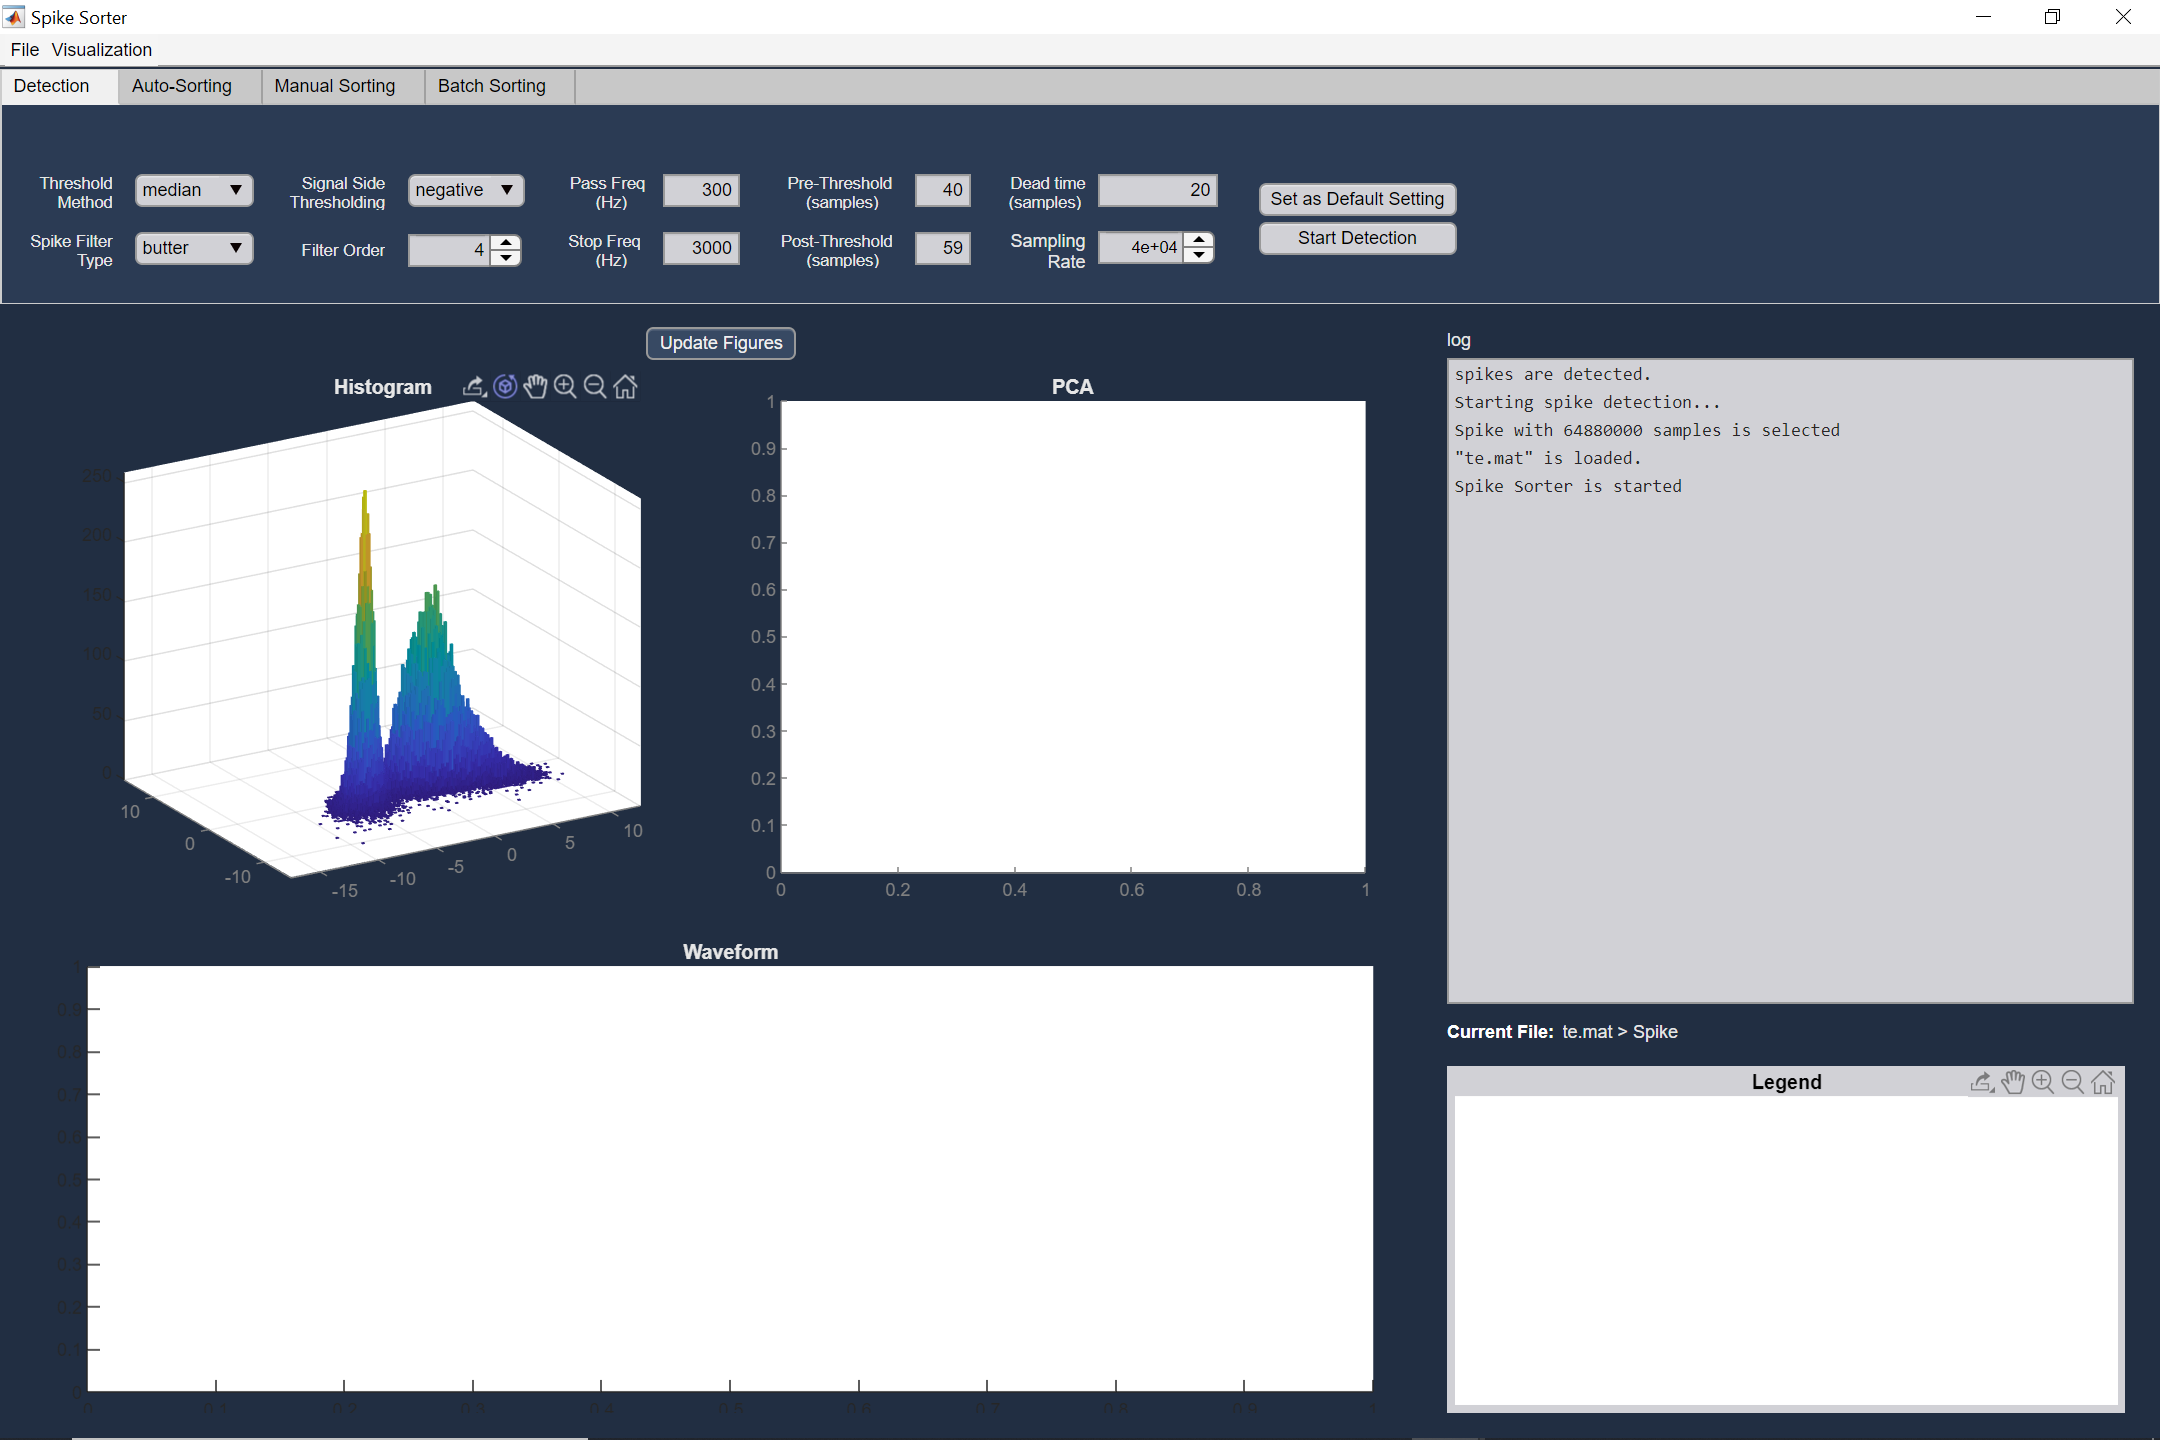
filtering and thresholding
You can load your raw recorded data. The first step is activity detection. In this step, spikes are extracted from the bandpass filtered signal. A common way to detect spikes is to determine activities that cross a threshold. The threshold is calculated based on the estimated noise power. You can change default options (e.g. filter type, thresholding method, ...), to have an accurate detection phase. The detected spikes and their corresponding times of occurrence could be saved as a MAT file.
Automatic sorting tool based on five popular methods
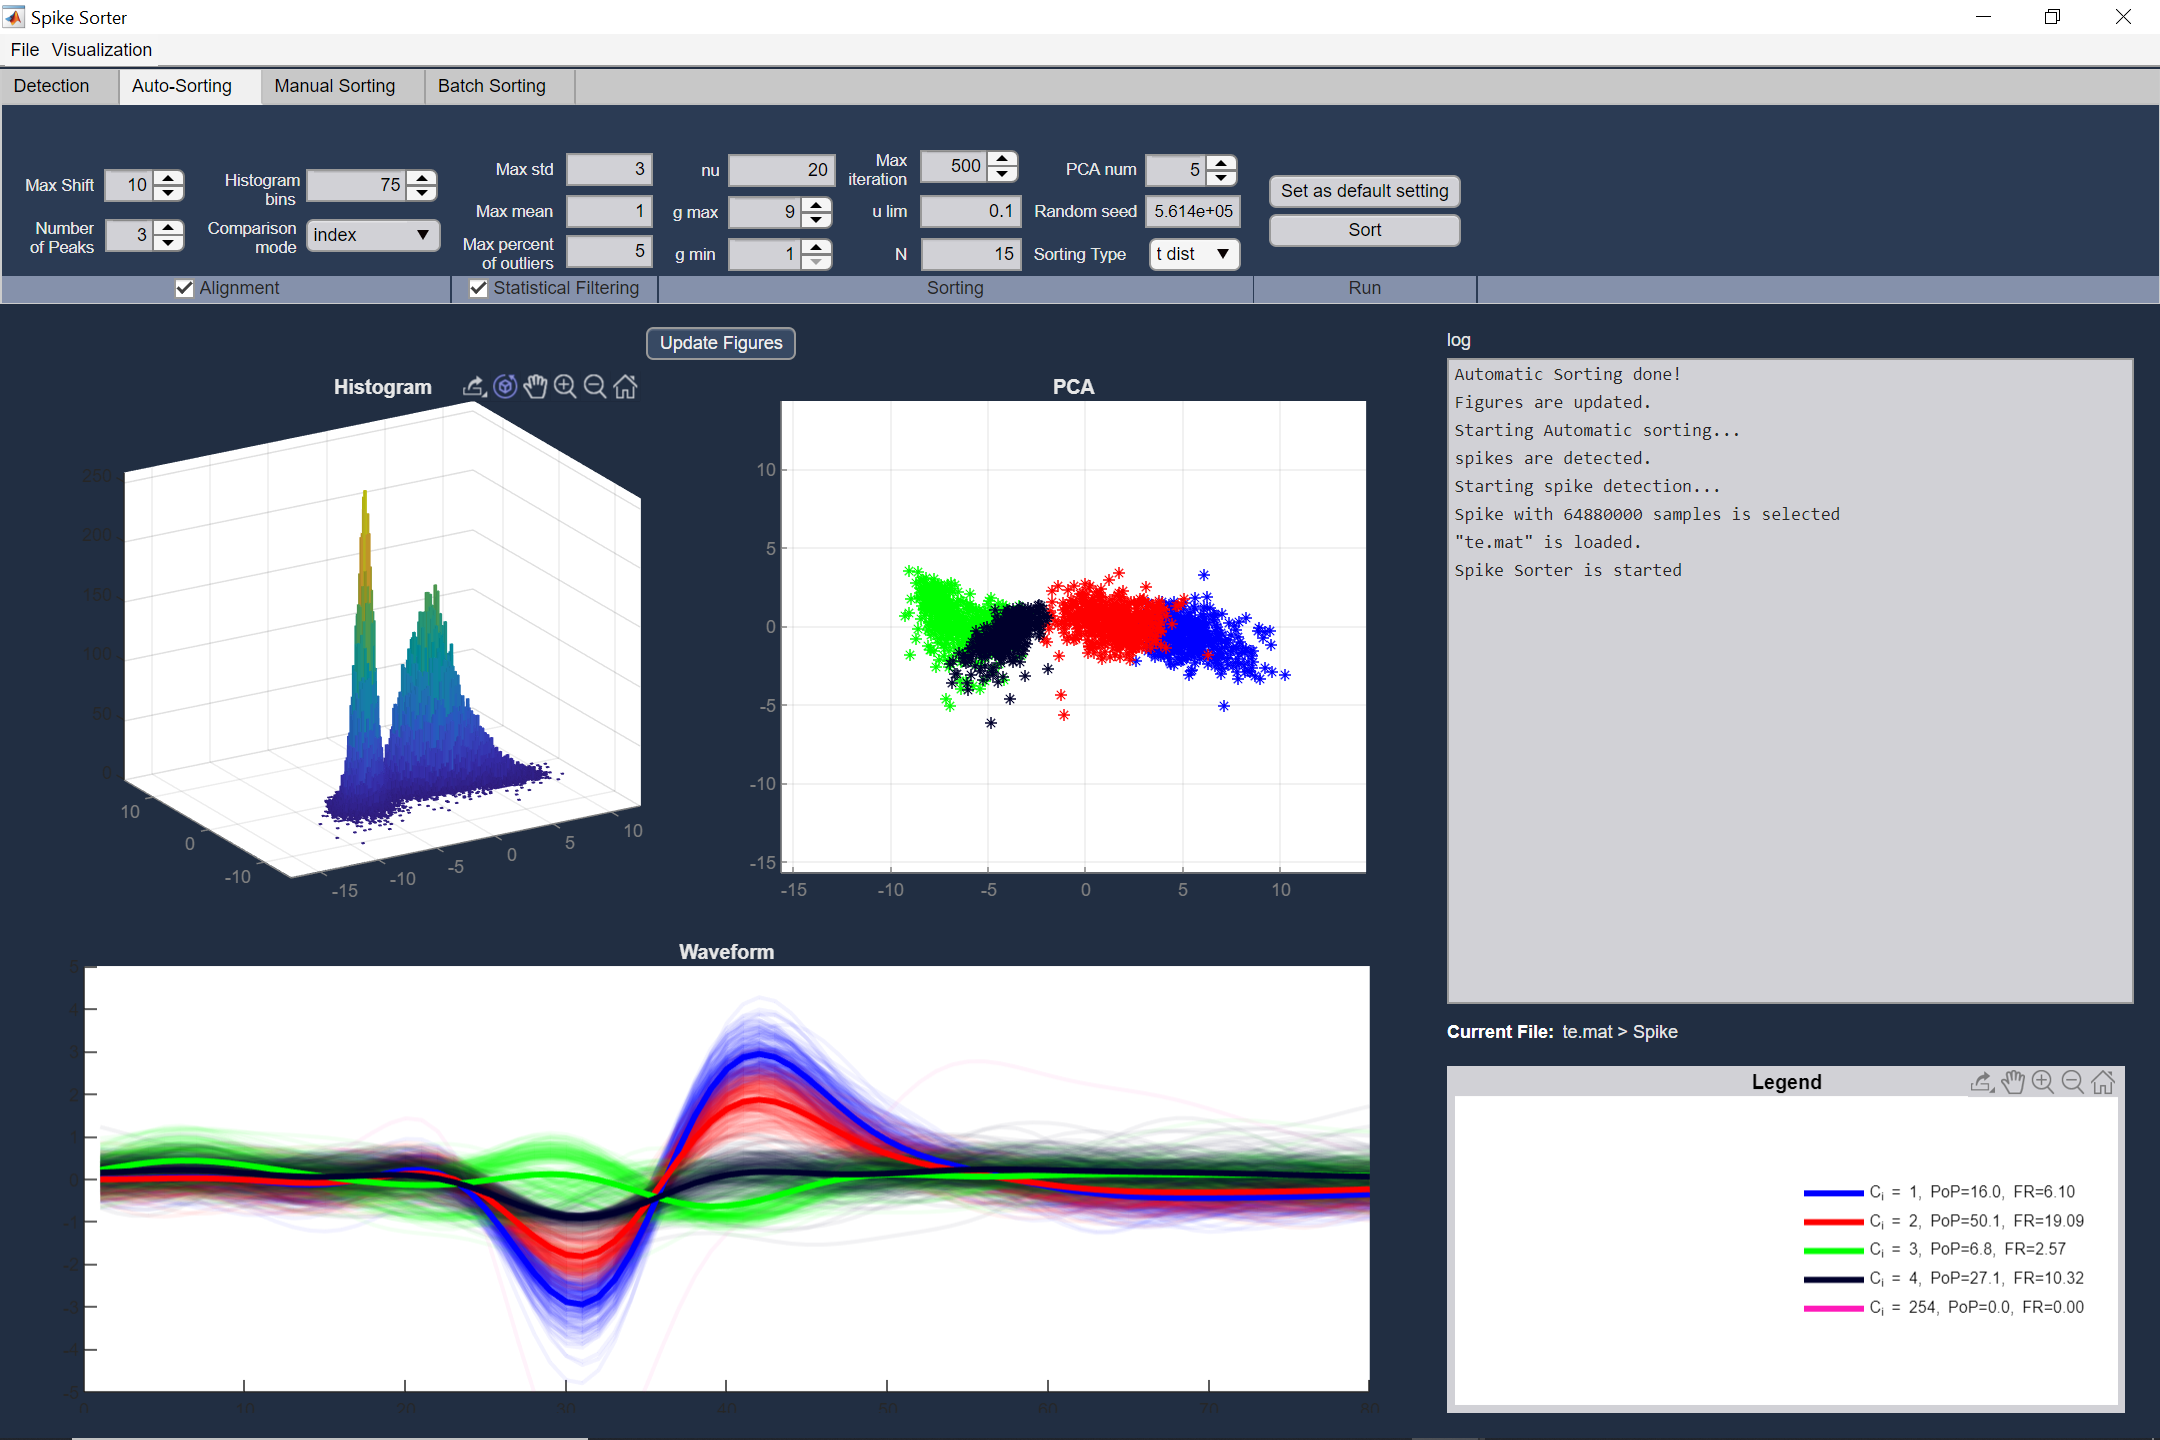
Auto sorting is a clustering method used to assign each spike to the corresponding neuron, automatically. Here we use mixture of t-distributions, GMM, k-means and template matching for clustering purposes. Also an statistical filtering method for noise (outlier) removal and a rich alignment method are provided. The output of this section is cluster indices for each spike waveform, which could be saved as a MAT file.
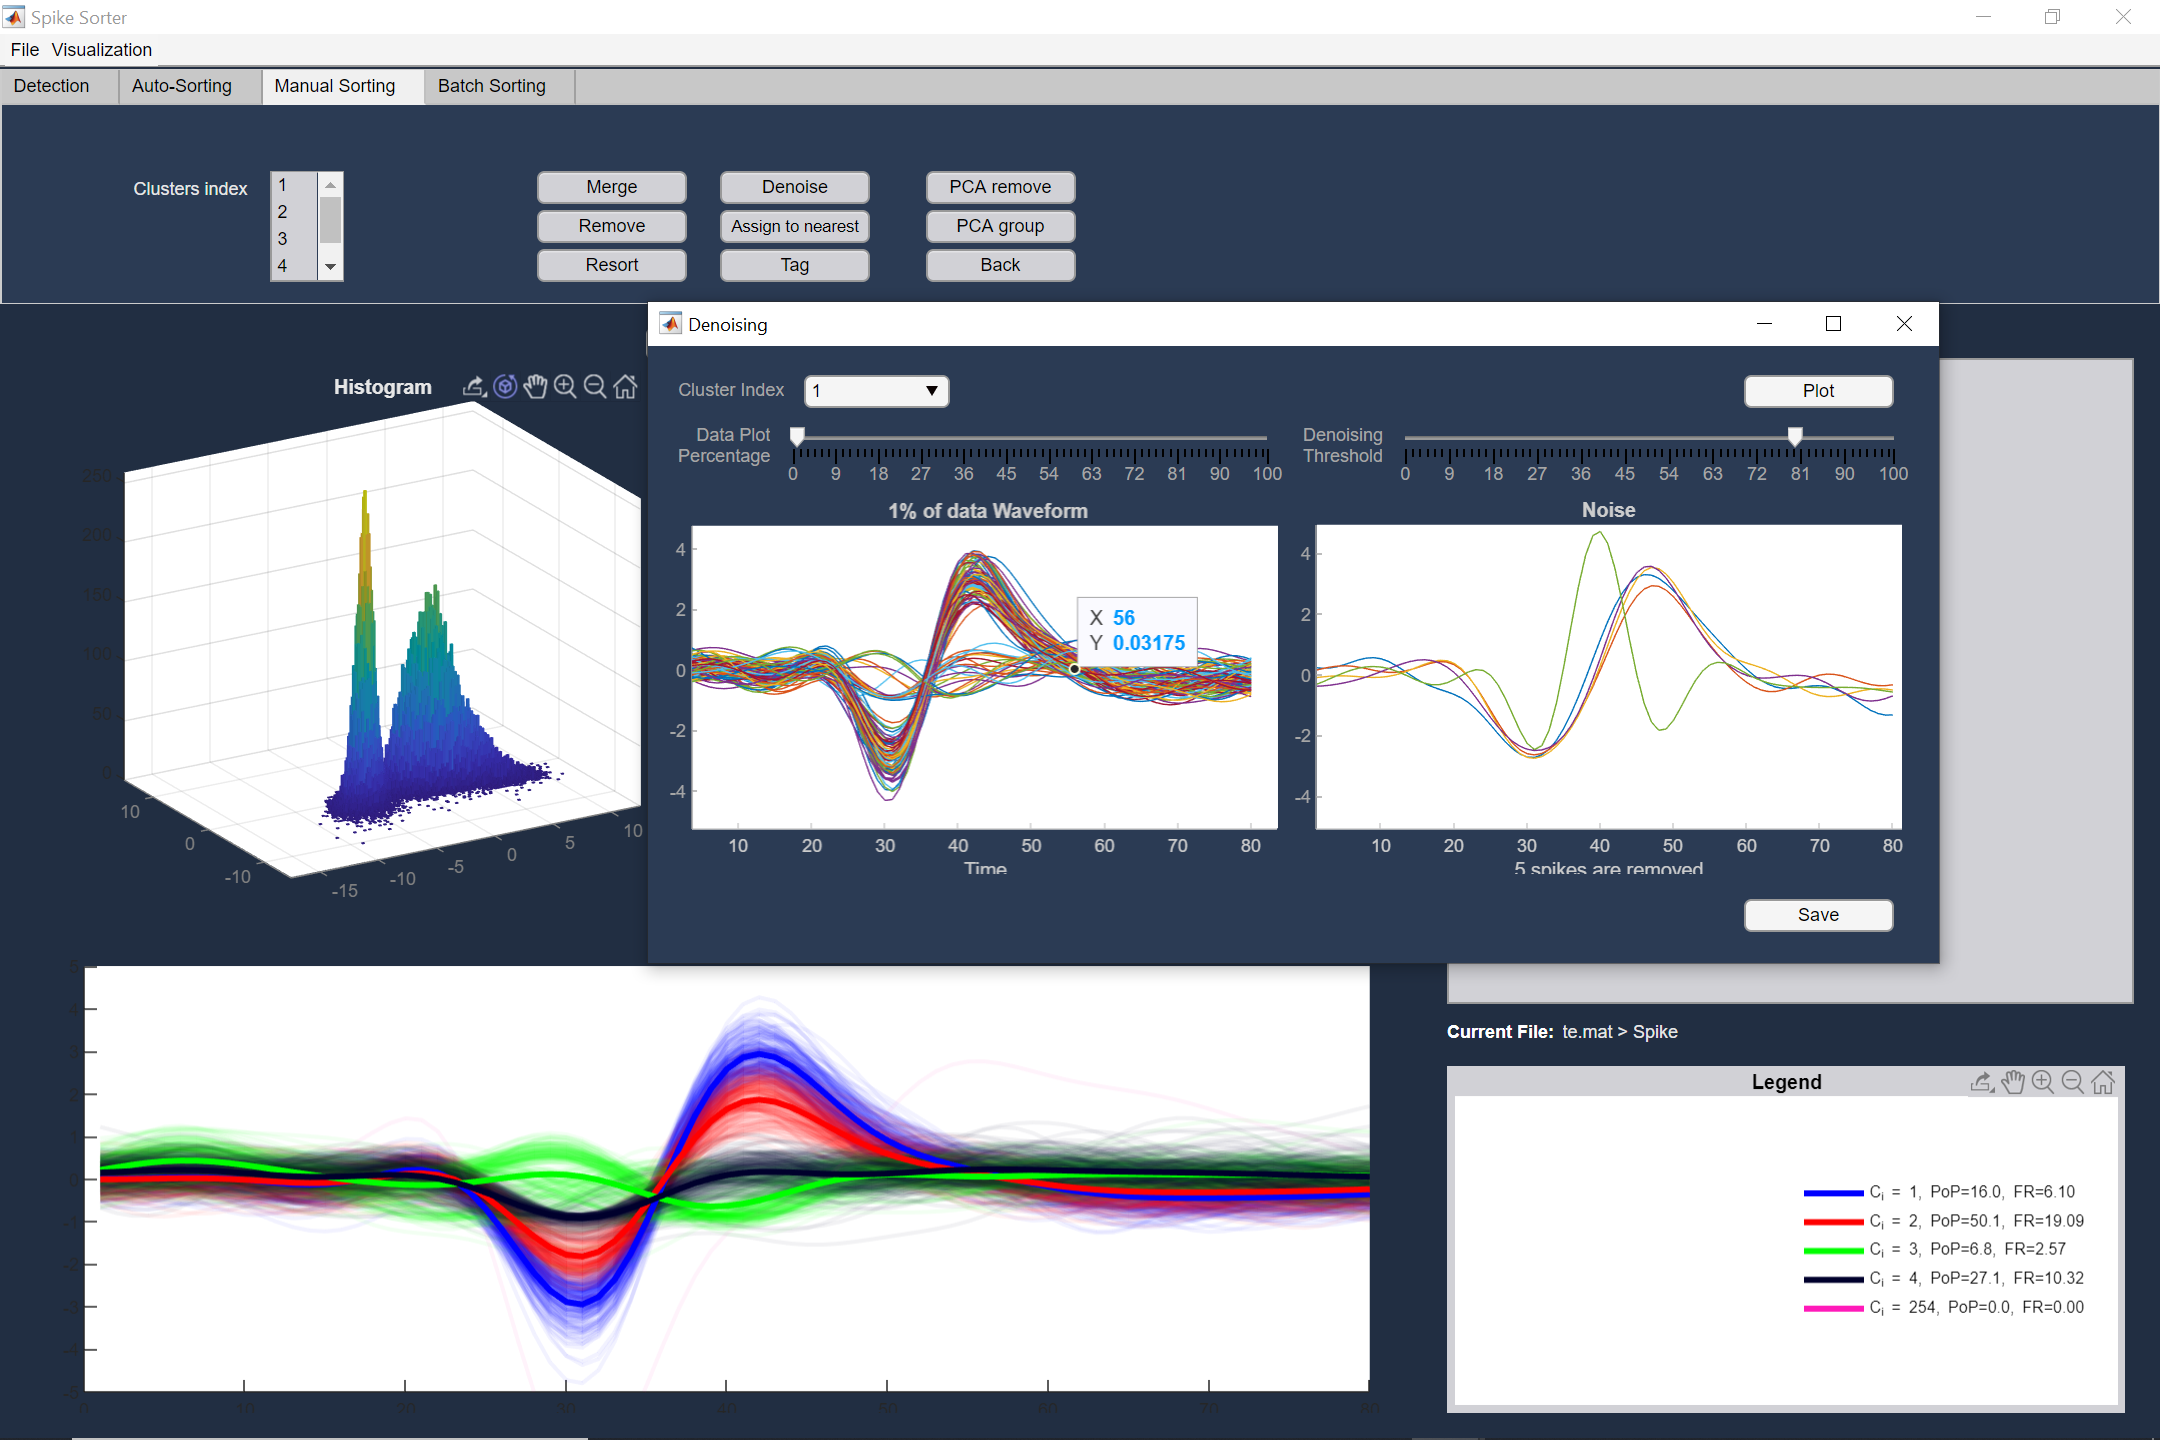
Several manual tools for modifying the auto-sorting results
Manual sorting provides several tools to modify the auto sorting output in order to improve it. These tools include: Merge, Delete, Resort, Denoise, and Manual grouping or deleting in PCA domain of clusters. Also, you can tag the neurons with arbitrary comments for further analysis. The cluster indices alongside the neuron tags could be saved as a MAT file.
Visualization tools needed for manual analysis on spike detection and sorting results
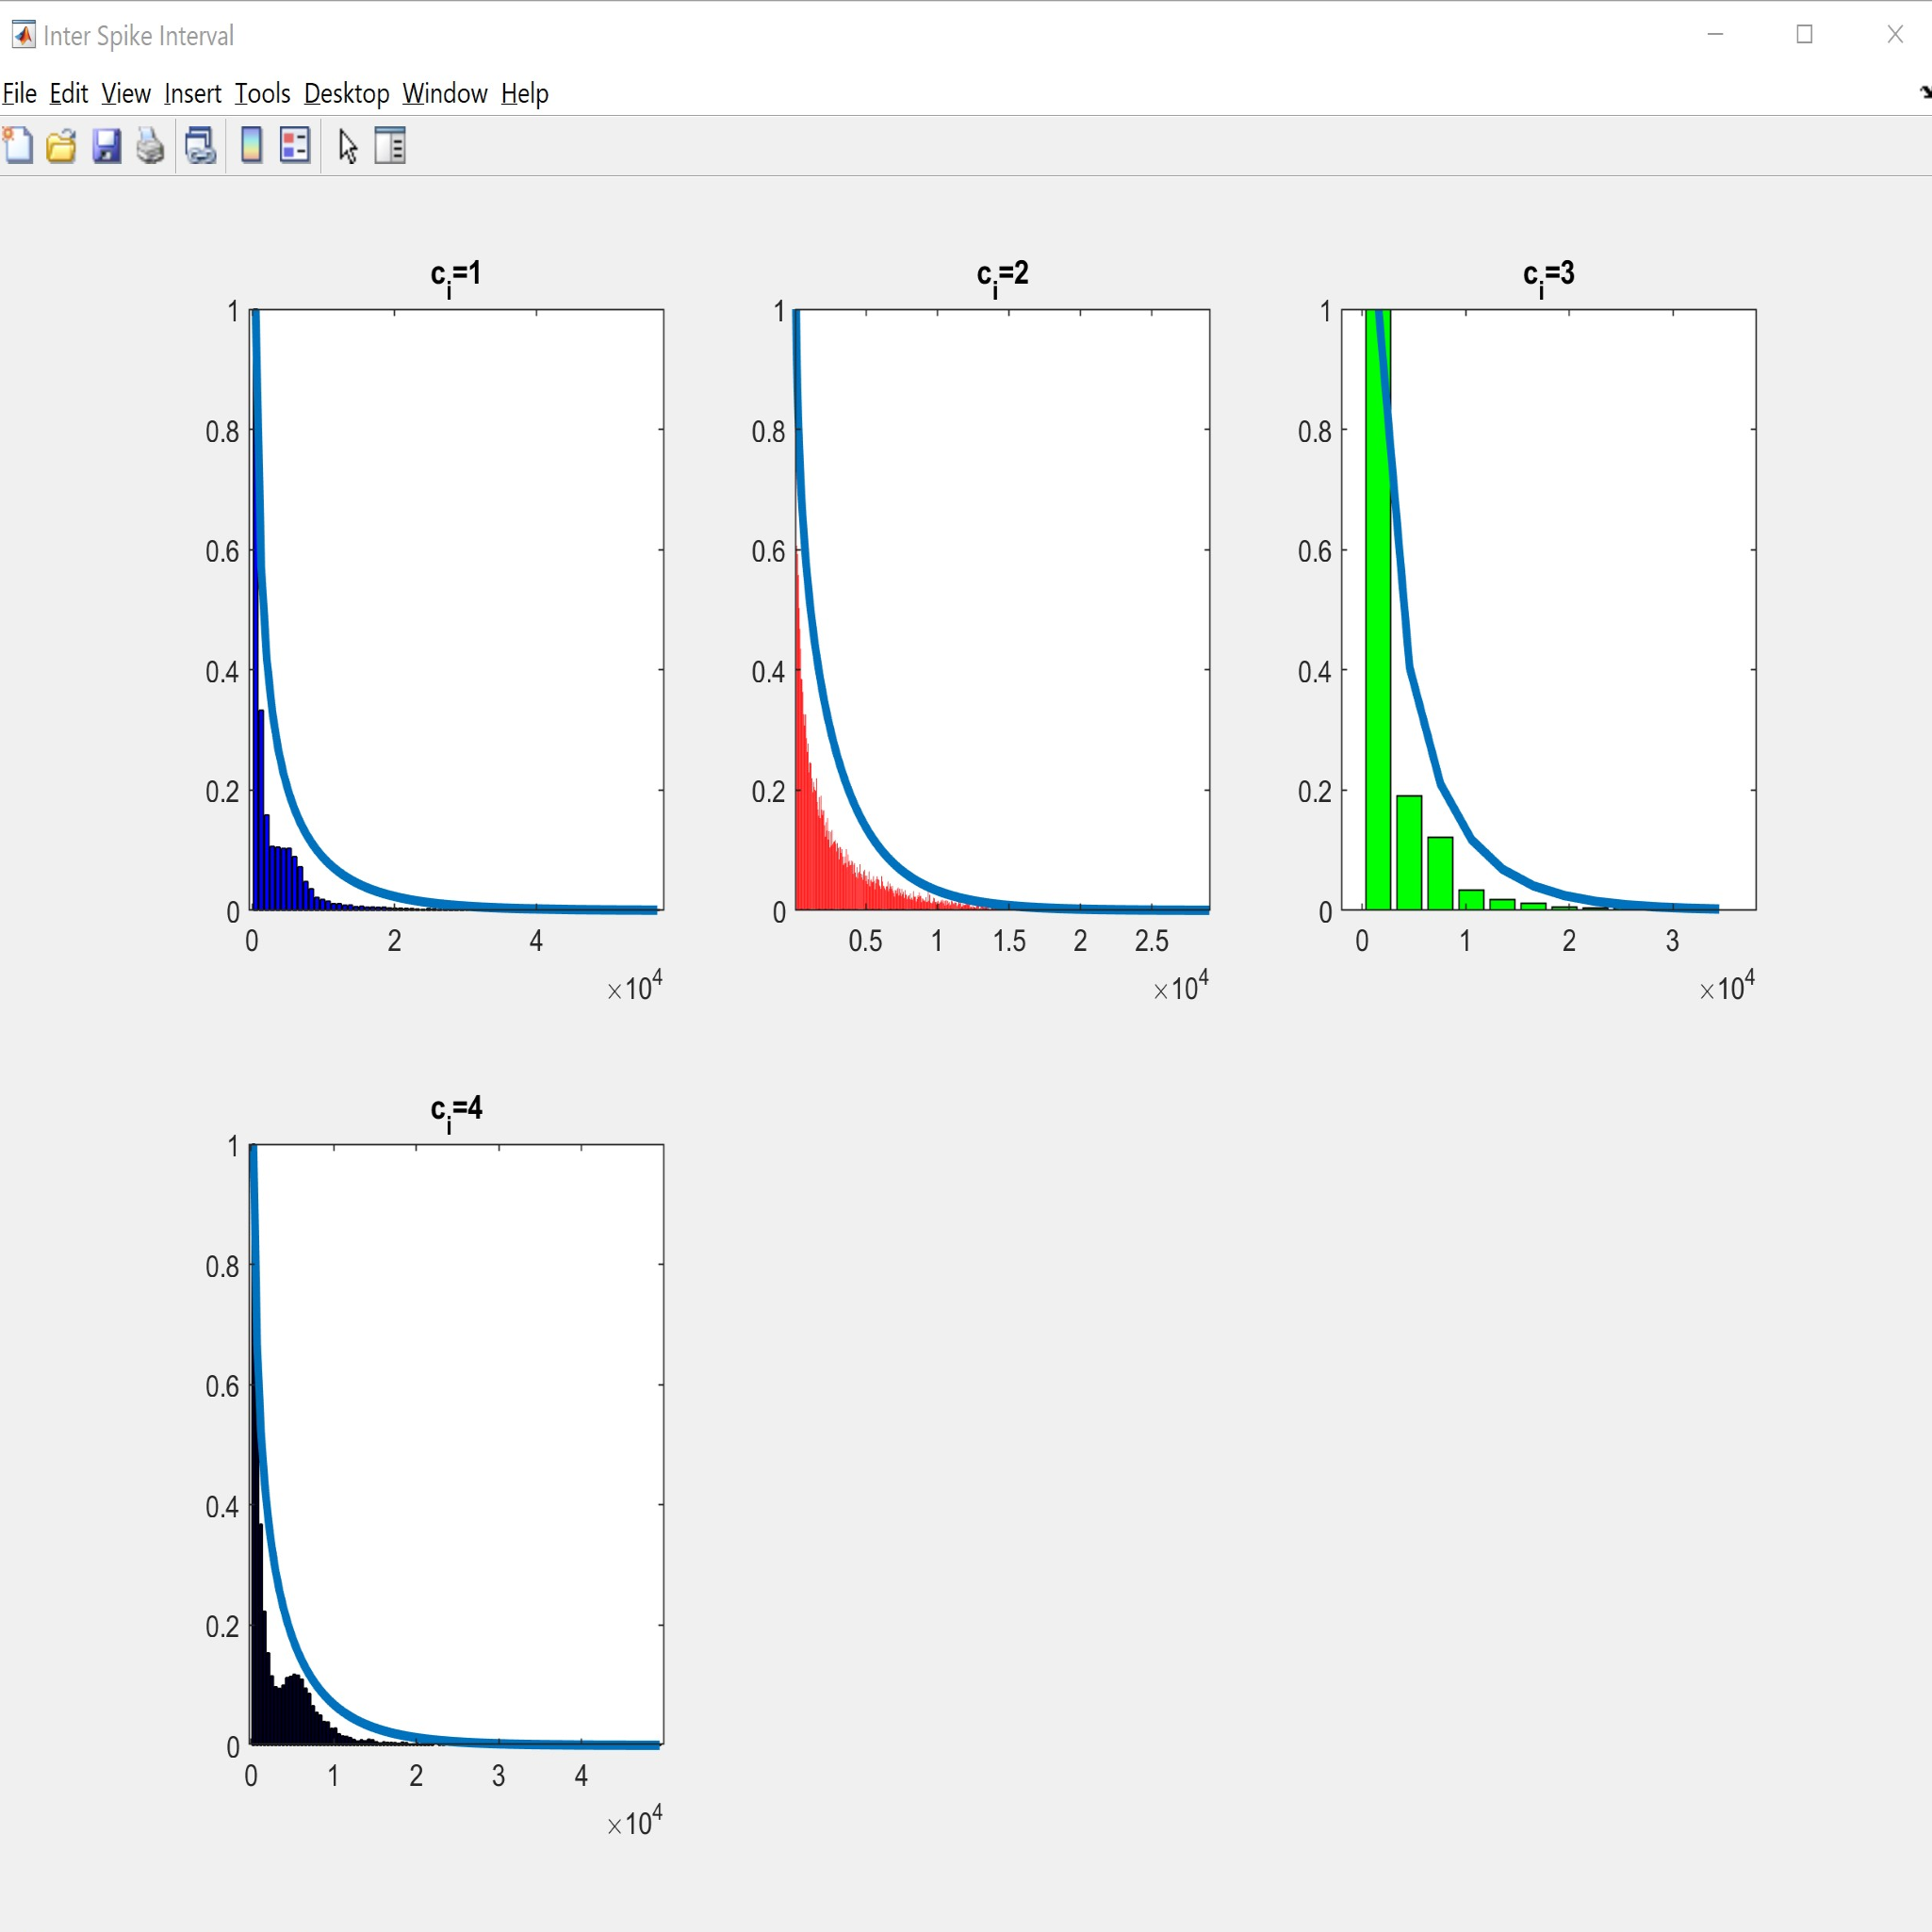
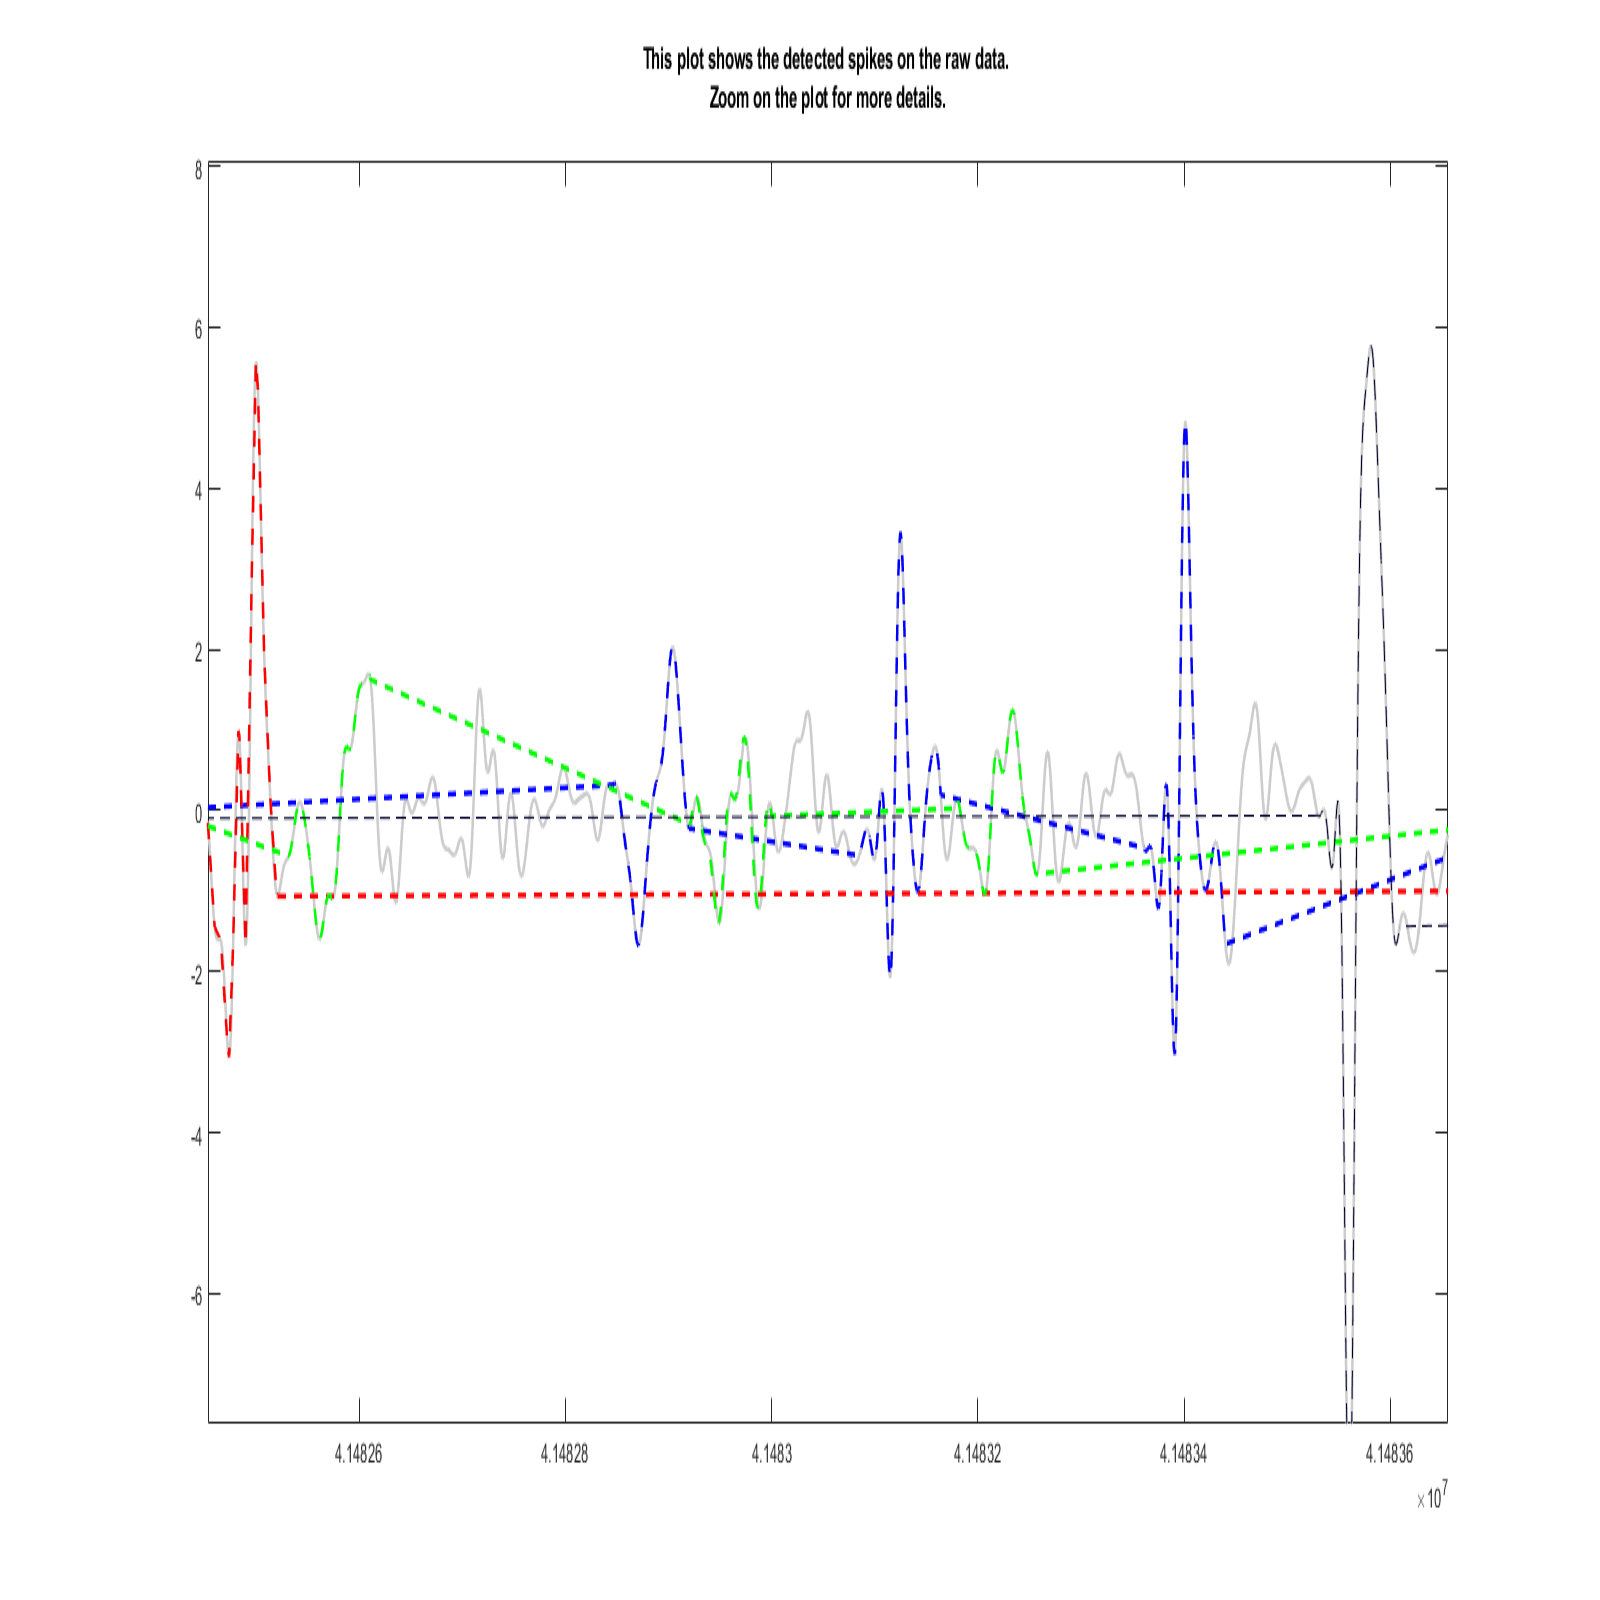
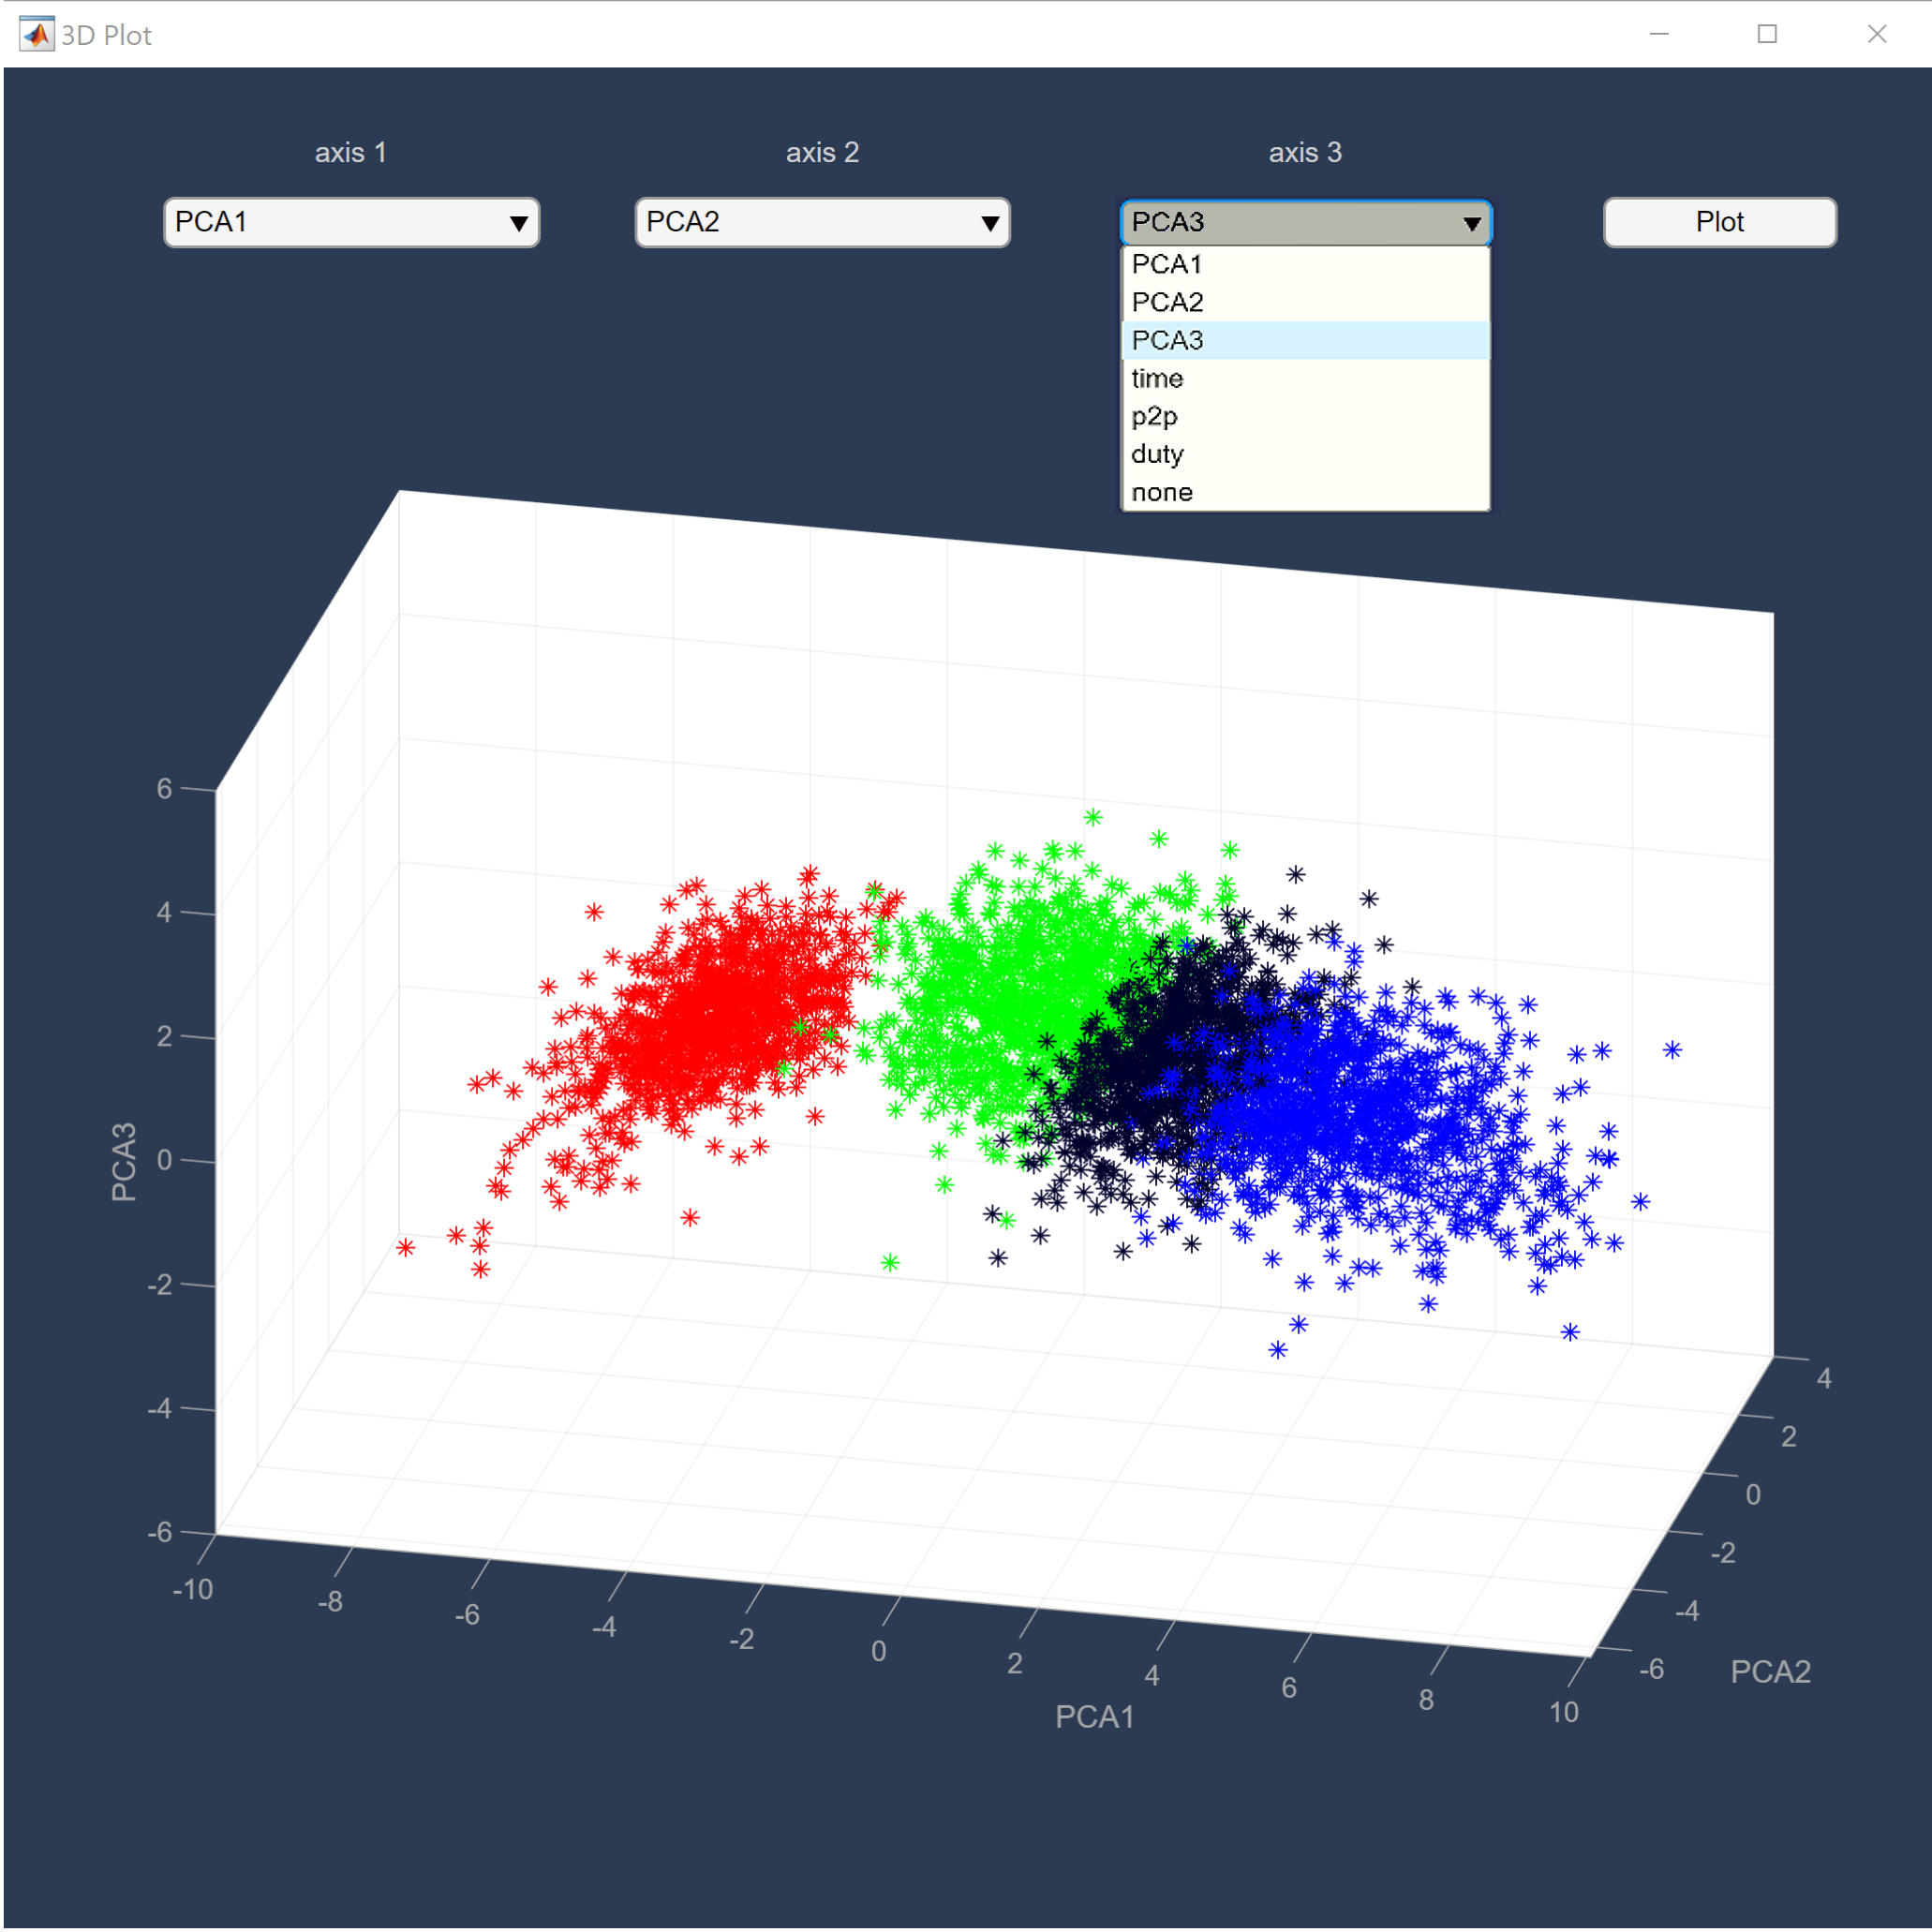
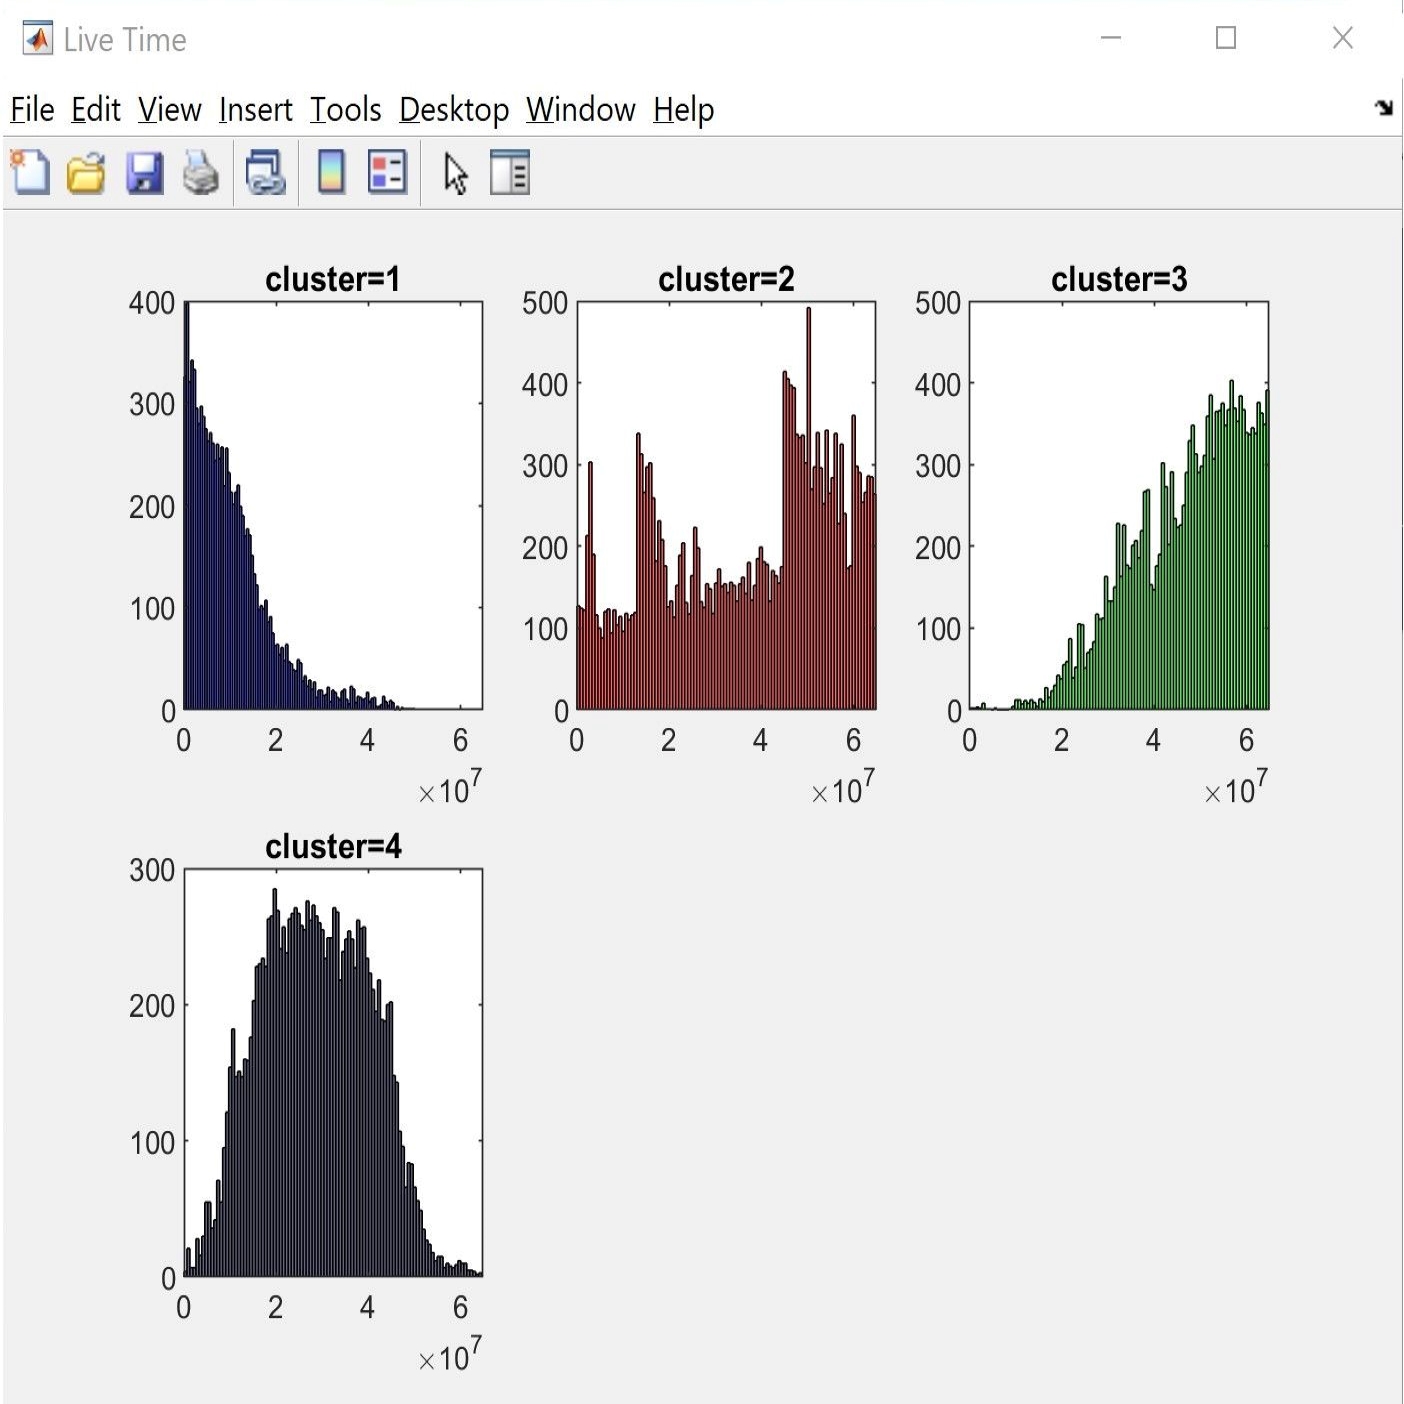
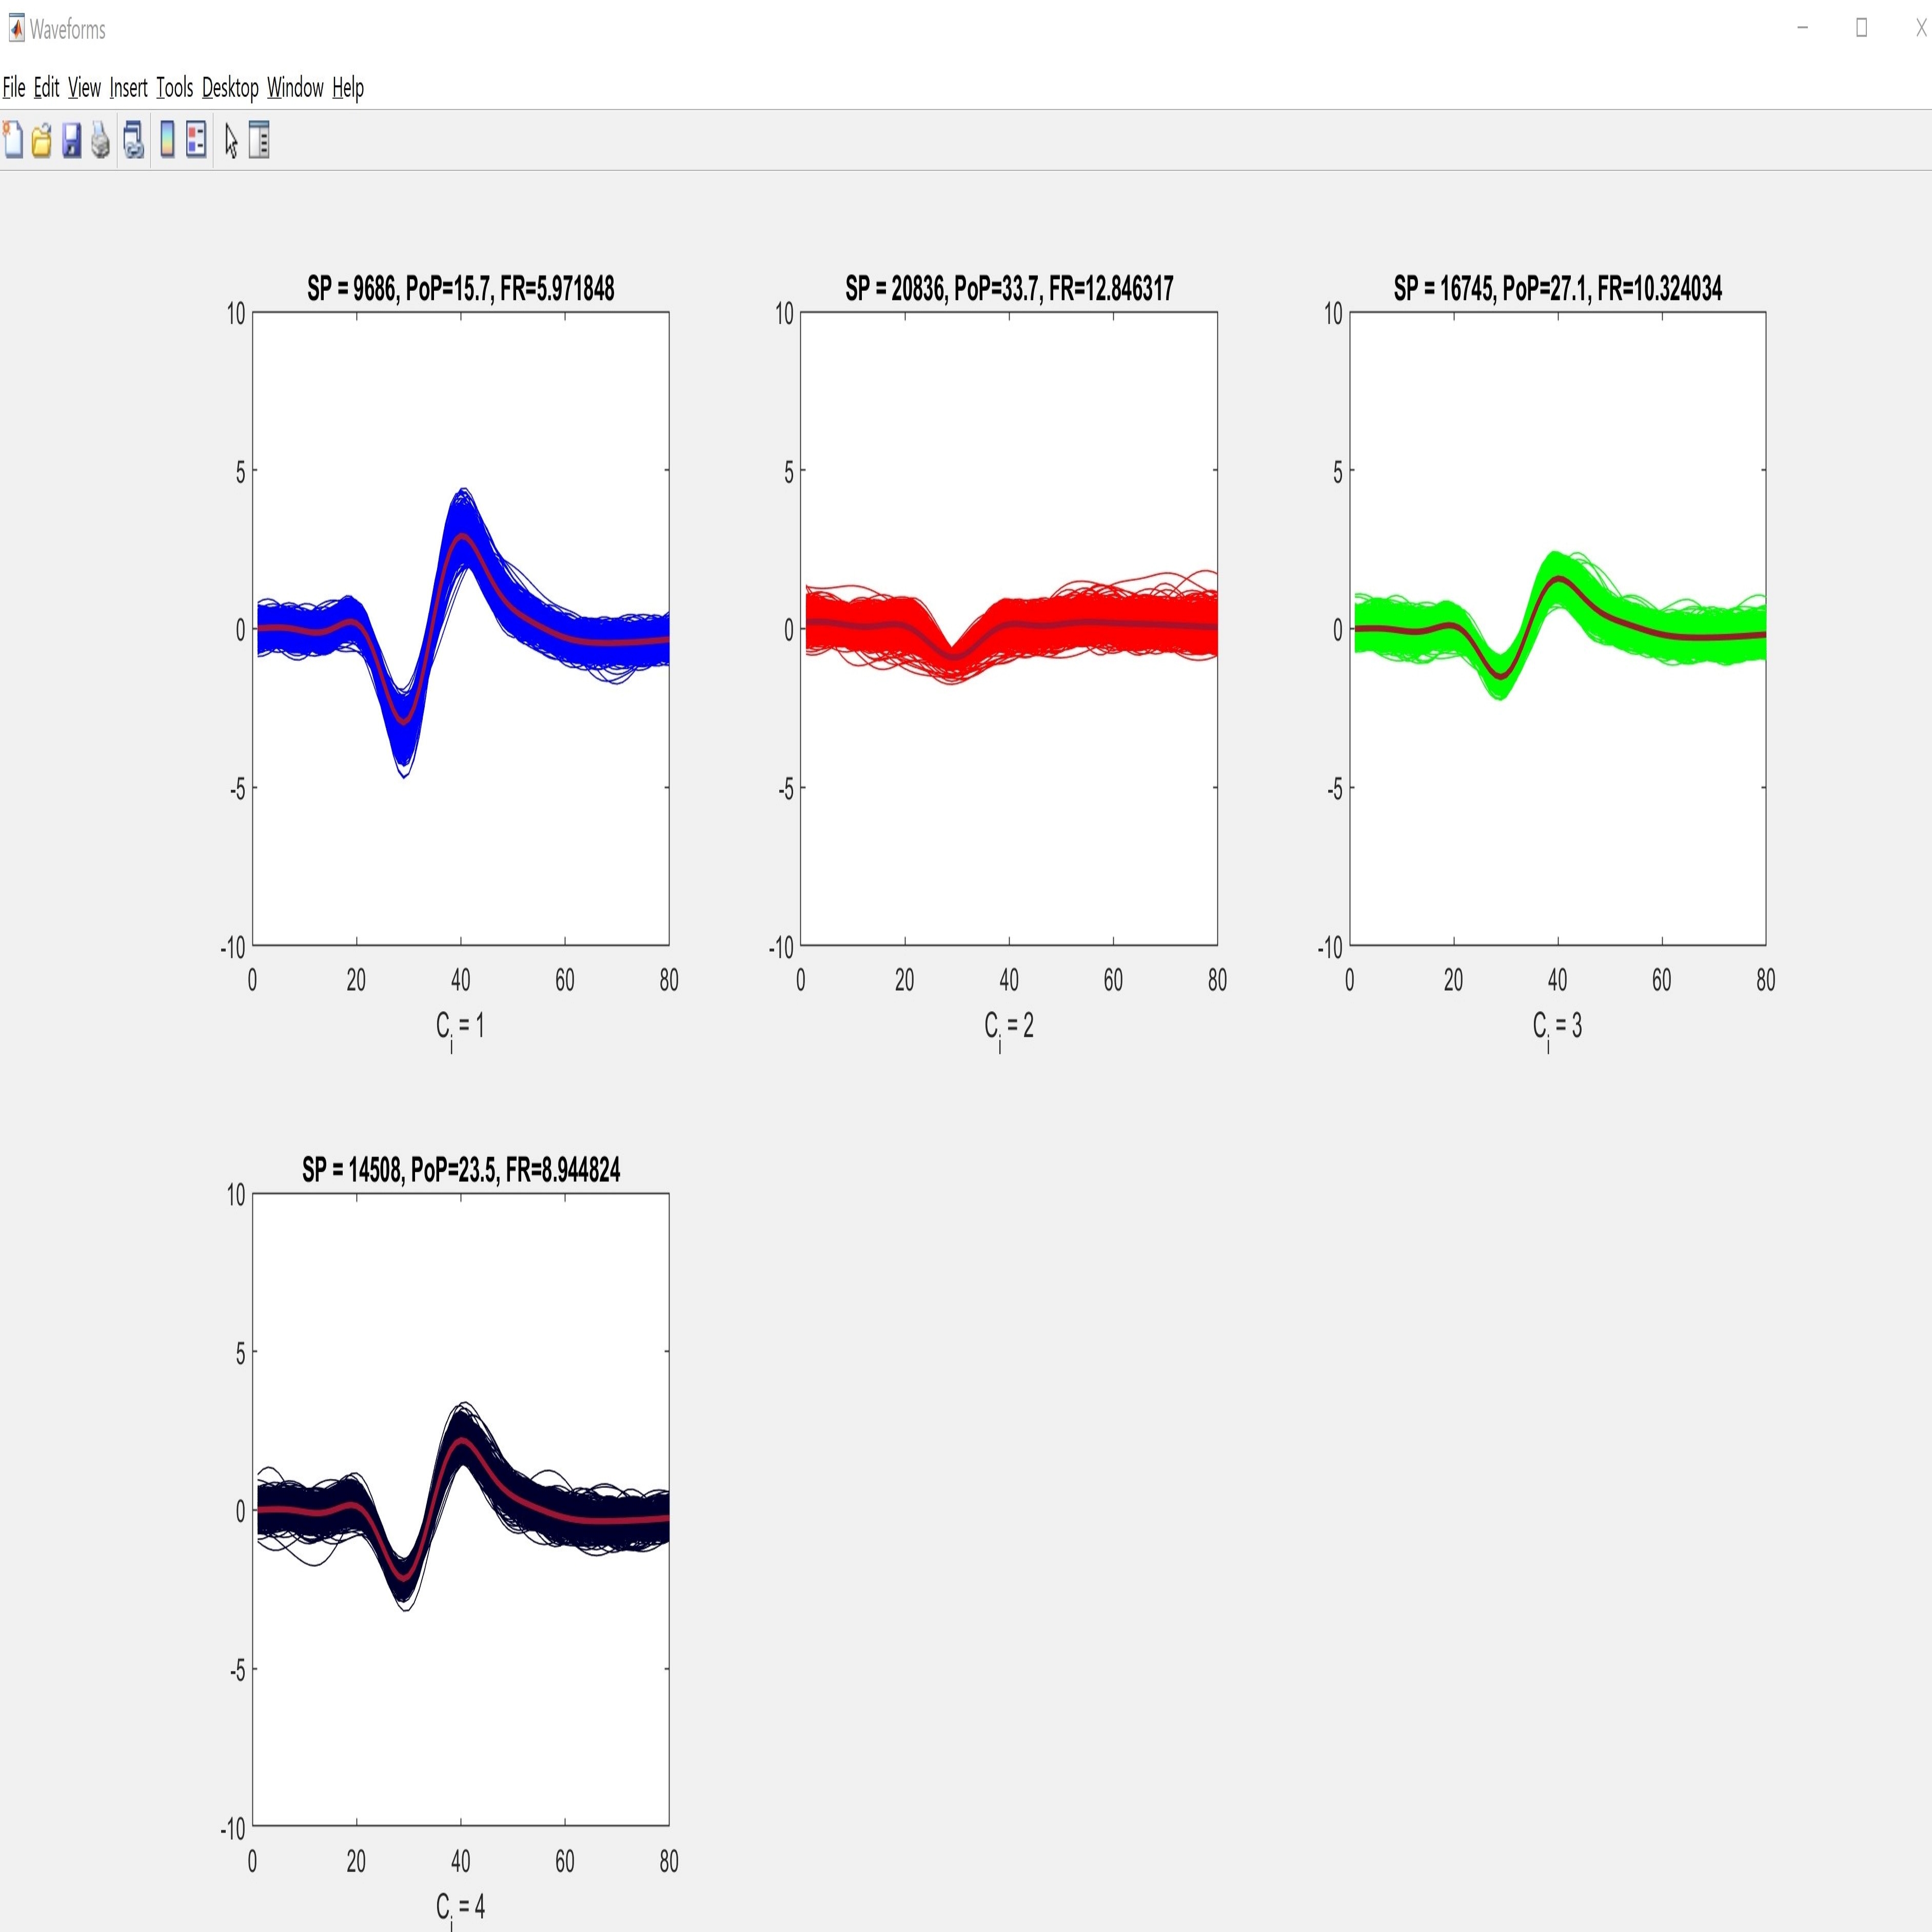
We present rich set of visualization tools which make it easier to comprehend. These tools include but are not limited to Inter spike interval, Neuron live time, Waveforms, 3D plot, and PCA domain plots. Also, you can track detected spikes on the raw data. In 3D plot you can choose arbitrary features for each axes, such as principle components and time of occurrence. Each neuron has a unique color across all visualizations in software. The color assigned to each neuron is illustrated in the legend section in the main window.


r.toosi@ut.ac.ir

m.aryan@ut.ac.ir

kimiadinashi@ut.ac.ir
abolghasemi@ipm.ir

akhaee@ut.ac.ir